UX Research
Validated Learning Process
Validated learning is a process of hypothesizing, measuring, and validating how a certain components of our product best engage our audience. So while we may believe we understand that audience, their real world actions speak louder than our hypothesis.
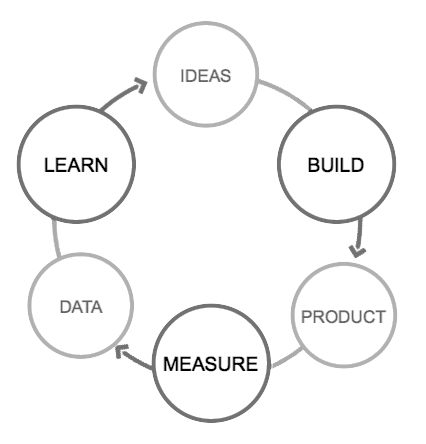
Each validated or disproved hypothesis brings us closer to understanding our target audience, their drivers, inclination & behaviour, so we can come at actionable insights on how modify and optimize our product pages to serve value and solve pain-points.
Hypotesis Construction
Before we start measuring interactions or writing customer interviews we’ll start by creating an hypothesis on how a specific point of interaction, a page, or a flow may be better constructed to the target audiences and for what reasons. Only once we have a solid idea of what we’re searching for will we be able to effectively define our analytics and write our customer interviews. Our aim when constructing an hypothesis would be:
Removing Friction
As we evaluate our funnels, and the number of users converting at each stage we’ll attempt to identify those specific steps which have the most friction, i.e have an unproportional amount of user churn. We’ll then evaluate the wireframes and page-behavior in order to hypothesize exactly what is causing this friction so how we may offer a design variation and test it for better results and lower friction.
Identifying Desire Paths
As we evaluate user-interactions throughout the user-flows we’ll attempt to identify specific pathways which are getting an unproportional amount of interactions considering our currently defined user-path. By identifying these desire-paths we’ll optimize our product’s user-paths and wireframes to better accommodate the purpose of the desire-paths we’ve discovered.
Quantitative Research
Quantitative research is an empiric, measurable research of user interactions throughout our funnels, landing pages and product pages, so we can gather insights regarding what users do.
Tools such as Google Analytics (GA), will give us a macro-view of how users interact with our product pages allowing us to segment them according to demographics, previous interactions and more as well as view a cohort chart in order to find friction points for specific user-types or personas.
Tools such as Mixpanel allow us to also have a micro-view of user-interactions, mapping out unique user sessions that have taken place, and walking us through their use of our product.
Before we start gathering data regarding user-segmentation and interactions, we must properly define our analytics i.e the specific interactions that will be measured and the customer-cohorts or groups according to our hypothesis.
Qualitative Research
Qualitative research is a subjective research involving surveys and user interviews so we can gather insights regarding what users say, their thoughts, opinions and understanding of our product, it’s value, and user experience.
User surveys are generally run via web forms or chatbots while user interviews may be conducted via phone, skype or face-to-face meetings.
Just as with quantitative analysis, it’s important to direct the interview or survey questions towards validating our hypothesis with a little bias as humanly possible. Being in shock and defensive in the face of a disconnect from our target audience during interviews takes us a step back, while an open ear and mind takes us forward.
At times we might find negative correlation between quantitative and qualitative tests referring to the same issue, in those cases we’ll tend to trust the quantitative, this of course doesn’t at all reduce from the importance or value of a qualitative research.
Optimization
Funnel, page, and product optimization involves hypothesizing exactly why a certain page is underperforming, then running UX research, as above, in order to make changes to it.
Optimization is generally accomplished via split test otherwise known as A/B tests, automatically segmenting users to one of the two groups presenting each with different page variations. Group A would generally be the control group viewing old, regular and vanilla version of the page, while Group B would be presented with the new version we hypothesized would work better. As the test goes on we’ll monitor which group has better KPI rates focusing on the specific variations we’re running. for optimal results, it’s best to set several KPIs for measuring the success rate of each variation
A/B/C/D/n tests, called multivariate test, are also possible though they are significantly more complex to analyze and require an exponentially larger sample size, so as a general rule we’ll prefer running several tests in place of a multivariate test.
Key Performance Indicators (KPIs)
While looking through your analytics platforms may seem like an exhaustive affair involving an innumerable amount of metrics; KPIs are here to bring order to the chaos.
KPIs are those specific metrics which are defined as a measurement for success, usually by the Product Manager or CEO.
Most times KPIs will be attached to a specific Objective, where different roles have different objectives and different KPIs measuring those objectives. This process is called OKRs - Objectives and Key Results. This allows for each role to focus on their specific objectives and metrics instead of sifting through endless amount of meaningless data without gaining any actionable insights or validated learning milestones.