The Customer Lifecycle
Often referred to as the sales funnel, or buyer’s journey, the customer’s life cycle describes the successful pathway our customers take towards becoming satisfied, paying, long-term customers.
Using the customer life-cycle as a marketing framework gives us a unique edge in planning & assessing our marketing performance – we can identify friction points in which customers tend to churn, define the goals our marketing campaigns aim to accomplish, establish effective persona concerns and more.
Each of our campaigns and endeavors in social media, email, content marketing and ad-buying are part of the customer lifecycle and serve a specific purpose in pushing prospects further down the funnel.
We’re going to review three different frameworks for describing the customer lifecycle.
- McKinsey’s Customer Journey which describes the customer’s point of view
- The Inbound Methodology which describes our point of view as digital marketers
- And Pirate Metrics which provides an analytical framework for measuring success
Mckinsey’s customer journey
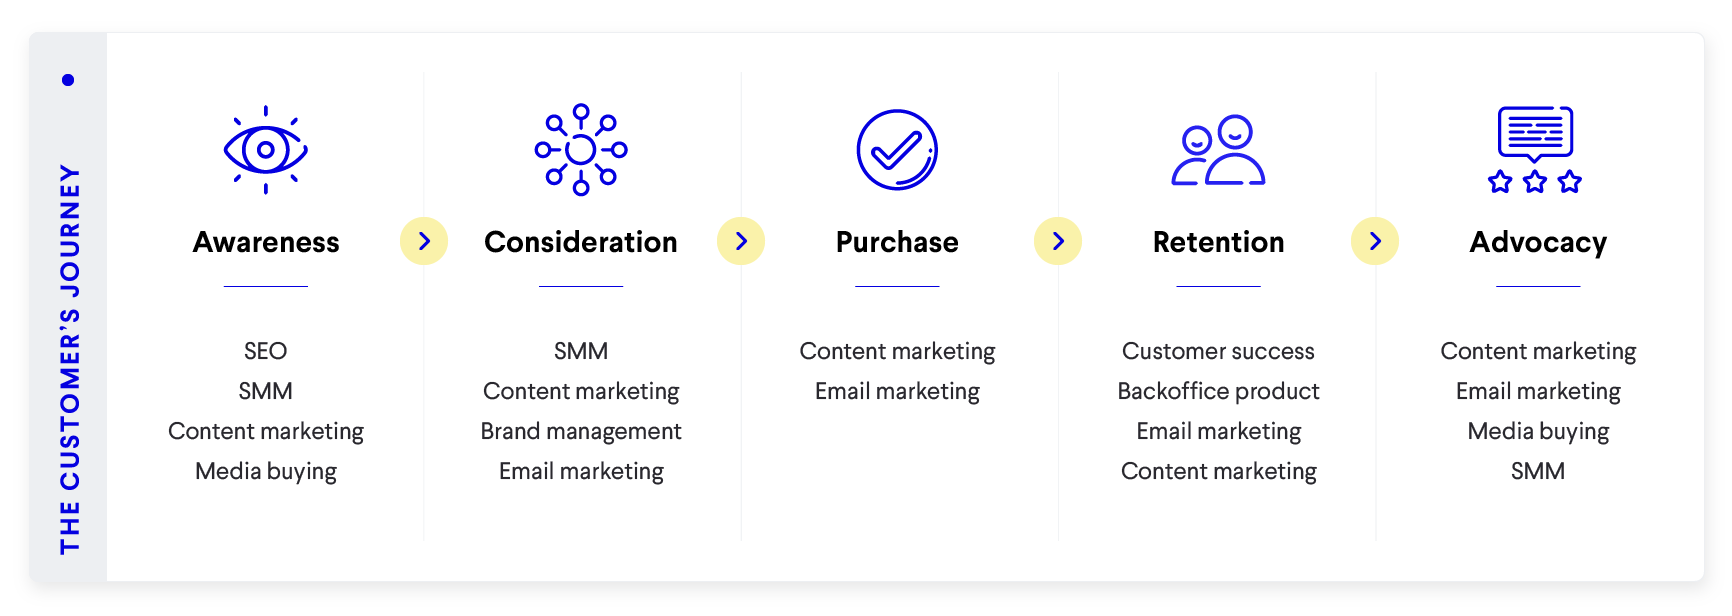
This framework describes how a potential customer, otherwise known as a lead or a prospect, might view us among our competition as well as all other content they consume.
At first, they become aware that we exist through our brand publicity efforts, such as ad-buying, posts on social media, advancing our position on search engines, and creating articles, images and videos.
At times you’ll see a stage called Familiarity as the next stage in which the lead will become familiar with our brand and product and recognize it from across the rest of the content that is directed at them.
Once they are aware of our solutions, they might consider us as a provider for solving their problem or requirement. This, of course, includes beta testing & free-trials.
In the next stage, the lead would purchase and use our product for the very first time.
After which they’ll come back & keep using it, hopefully, on a regular basis, leading to customer retention.
The now satisfied customer, would then recommend our product to acquaintances, bringing us fresh leads. This is the final stage which triggers a repeat of the previously mentioned customer retention process.
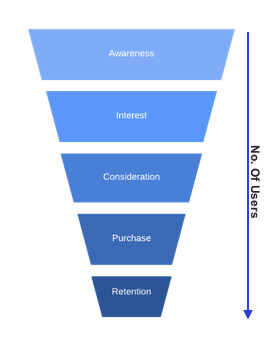
This is of course a funnel, as we progress down this funnel throughout the different stages– awareness, consideration, purchase, retention and advocacy, we’ll have less and less leads or customers than we had in the previous stage, In other words, each stage contains a percentage of its predecessor.
The Inbound Methodology
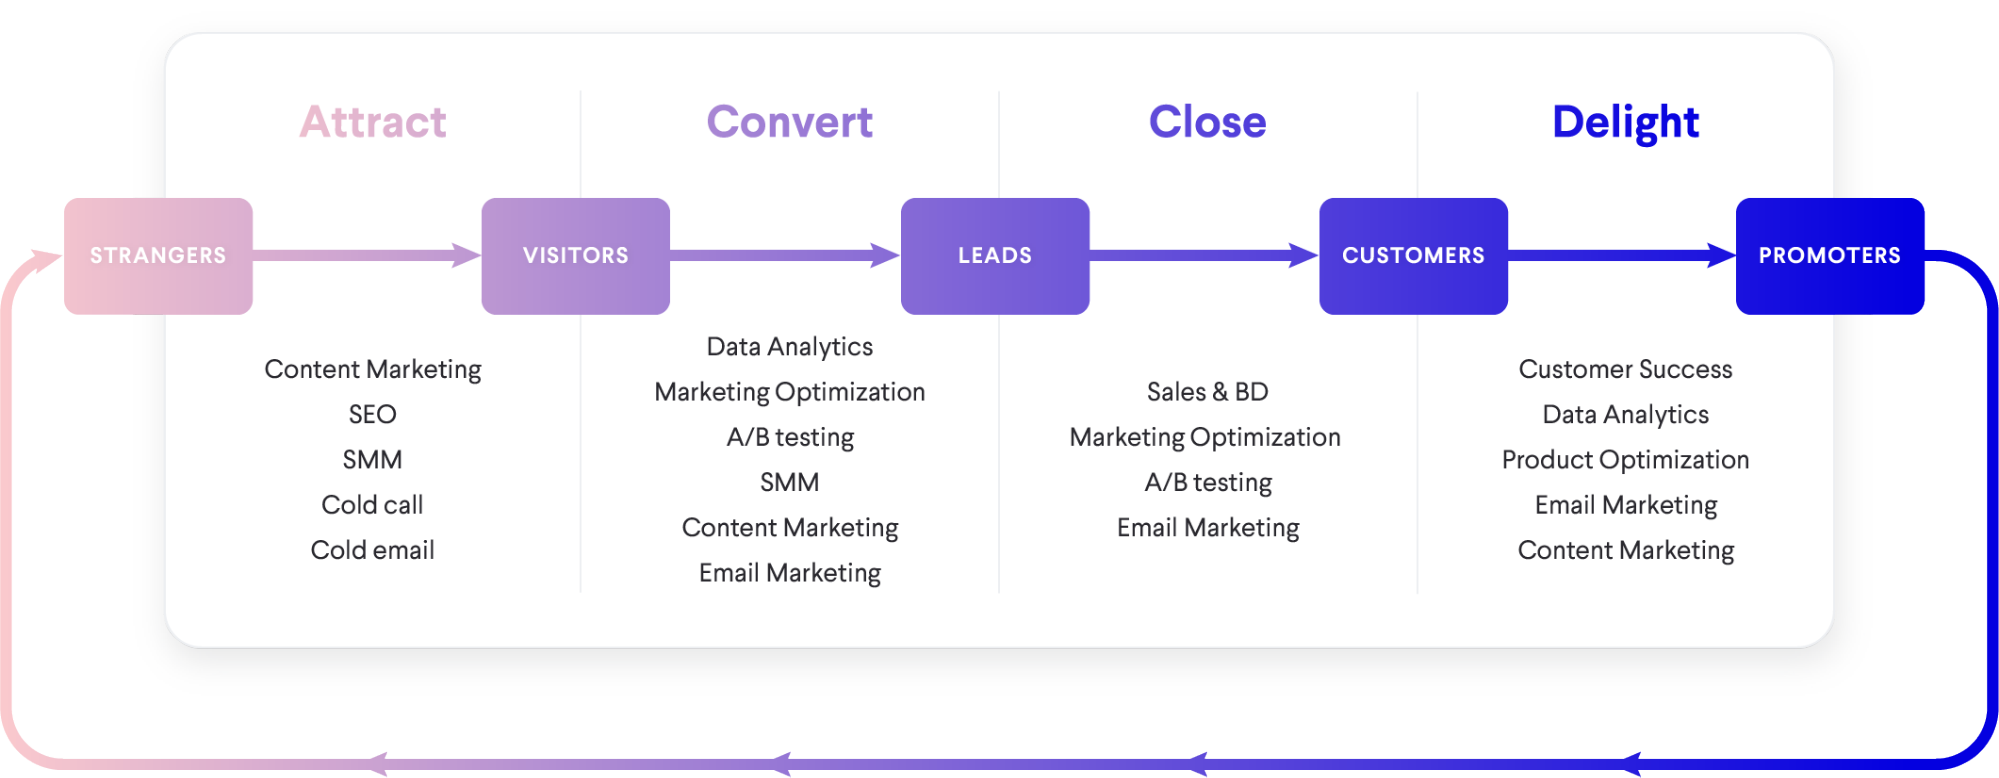
The inbound methodology describes, how we as digital marketers attempt to impact strangers into becoming paying customers.
Attracting strangers to visit our brand presence through social media, search engines, email and cold calls Converting visitors into giving us their details e.g full name, email, phone number; and turning them into leads Closing Leads into paying customers And delighting our customer-base into staying as well as referring more traffic to our service
So, an office chat regarding the customer lifecycle might look something like this:
“In the awareness stage we have an overall 23% click-through-rate (CTR) on our social and search presences. However, we’re noticing a lot of friction at the consideration stage. There’s a 75% bounce rate. Only 3% of our visitors are converting into leads but 67% of these leads end up purchasing our product.”
“So we’re bringing in a lot of prospects, most of which find our product immaterial. But those that do take interest are choosing us instead of our competitors two thirds of the time.”
“We need to refine our approach. It could be that the scope of our product or branding is too narrow and we should revise our marketing language or develop a larger features-set.”
“It might also be that our organic content is broader than our offering and people are mistaking our value for something else.”
“We should A/B test different solutions via email, social media, and on our website to find exactly what is causing our conversion problem.”
This is just an example of how the customer lifecycle is incorporated into the daily conversation of digital marketers. Don’t worry if you didn’t get all that, by the time you finish this course everything will be crystal clear.
Pirate Metrics!
So, the last two frameworks gave us a way to describe our efforts and our results at each stage of the customer lifecycle in a very broad manner. With pirate metrics, the data concerning each parameter is consistently tracked in order to intuitively identify points of friction, where potential customers will no longer be interested in our product.
Pirate metrics focuses on AARRR metrics
Acquisition: How do we get strangers to find us?
Activation: How do our visitors get to have a great first experience?
Retention: How do we get our users & visitors to keep coming back?
Referral: How do we get our users to tell others about us?
Revenue: How do we make money?
This is great for executives and analytics professionals to get the entire team to work together towards the same goals in an empiric or measurable way.
Acquisition includes metrics such as visits to homepage and landing-pages, bounce rate, visitor-session-time, number-pages-viewed-during-session and of course conversion rate.
Activation is measured by metrics such as registrations, feature usage, user session time, purchases and so on.
Retention metrics include number of sessions per user per day/week/month, interactions with our brand on social media, email open rate, feature adoption and more, Measured separately for Users and Visitors.
Revenue includes metrics such as customer acquisition cost, lifetime value, acquisitions per week or month, and more.
Referral is generally done via cohort analysis of users who referred registered users to our website, with the cohorts being how many users they referred, 1, 2, above 3, etc.
The chart below gives out an example of the AARRR framework at work:
| Stage | Metrics | Conversion Rate | Sample Size |
|---|---|---|---|
| Acquisition | Visits (Homepage, Landing pages), Bounce Rate, Visitor-Session-Duration, Visitor-Pages-per-Session | 70% | 1013 Visitors |
| Activation | Signup, Feedback, Usage | 20% | 709 Visitors |
| Retention | Visits per day/week/month, email open rate, CTR | 45% | 141 Users / 432 Visitors |
| Revenue | CAC, LTV, New customers per day/week/month | 20% | 141 Users |
| Referral | Number of referring customers, average number of referrals per customer, number of customers who made 1 referrals, 2 referrals, 3, 4, 5, etc. | 63 Users |